Assess business value
Use the business value dashboard to track process outcomes using cycle time, automation rate, activity, and agentic adoption metrics. Set targets for cycle time and automation rate, and find the processes that miss them.
To open the dashboard:
- In Camunda Hub, go to Business Value (
/business-value). - Use the Environment picker to select an environment.
- Review the portfolio view, then select a process to open its process view.
The dashboard shows data for one environment at a time and does not aggregate values across environments. Each value therefore belongs to the environment currently selected in the picker.
Availability and permissions
The business value dashboard is available in Camunda 8.10 and later, for clusters connected to Optimize.
The dashboard uses the same organization-level access rules as Optimize in SaaS and Self-Managed. Organization Owner, Organization Admin, and Analyst roles can access the dashboard. Member and DevOps roles can't. See roles and permissions for the full permission matrix.
Viewing the dashboard and setting targets require the same access. There is no separate read-only or target-editing permission.
The standalone Optimize role does not grant access to the business value dashboard. It can grant access to Optimize itself, but that alone is not enough to open the dashboard in Camunda Hub.
How the dashboard calculates metrics
Every metric on the dashboard follows the same rules.
| Rule | What it means |
|---|---|
| Completed instances only | Only completed process instances are counted. Running and unfinished instances are excluded from every metric, chart, and target comparison. |
| Targets are values you set | Camunda doesn't supply a default or benchmark target. Every target on the dashboard is one you entered. |
Automation rate definition
Automation rate is the share of counted tasks that are automated. It is calculated as automated tasks / (automated tasks + user tasks + manual tasks).
| Included | Excluded |
|---|---|
| Automated tasks, such as service tasks, script tasks, business rule tasks, and send tasks | Events and gateways |
| User tasks and manual tasks, which count toward the denominator | Sub-process containers themselves |
| Tasks inside embedded sub-processes, counted the same as tasks at the top level | Tasks in a process started by a call activity |
Structural elements are excluded because the automation rate counts tasks rather than events, gateways, or sub-process containers. A process built mostly from gateways and events is not automatically 100% automated under this definition.
Automation rate is calculated on the root process only. Tasks in a process started by a call activity count toward the automation rate of that called process, not the calling one.
Cycle time definition
Cycle time is the elapsed duration of a completed process instance, from start to end.
Review the portfolio view
The portfolio view summarizes all processes in the selected environment. Use it to see where targets are met and which processes need attention.
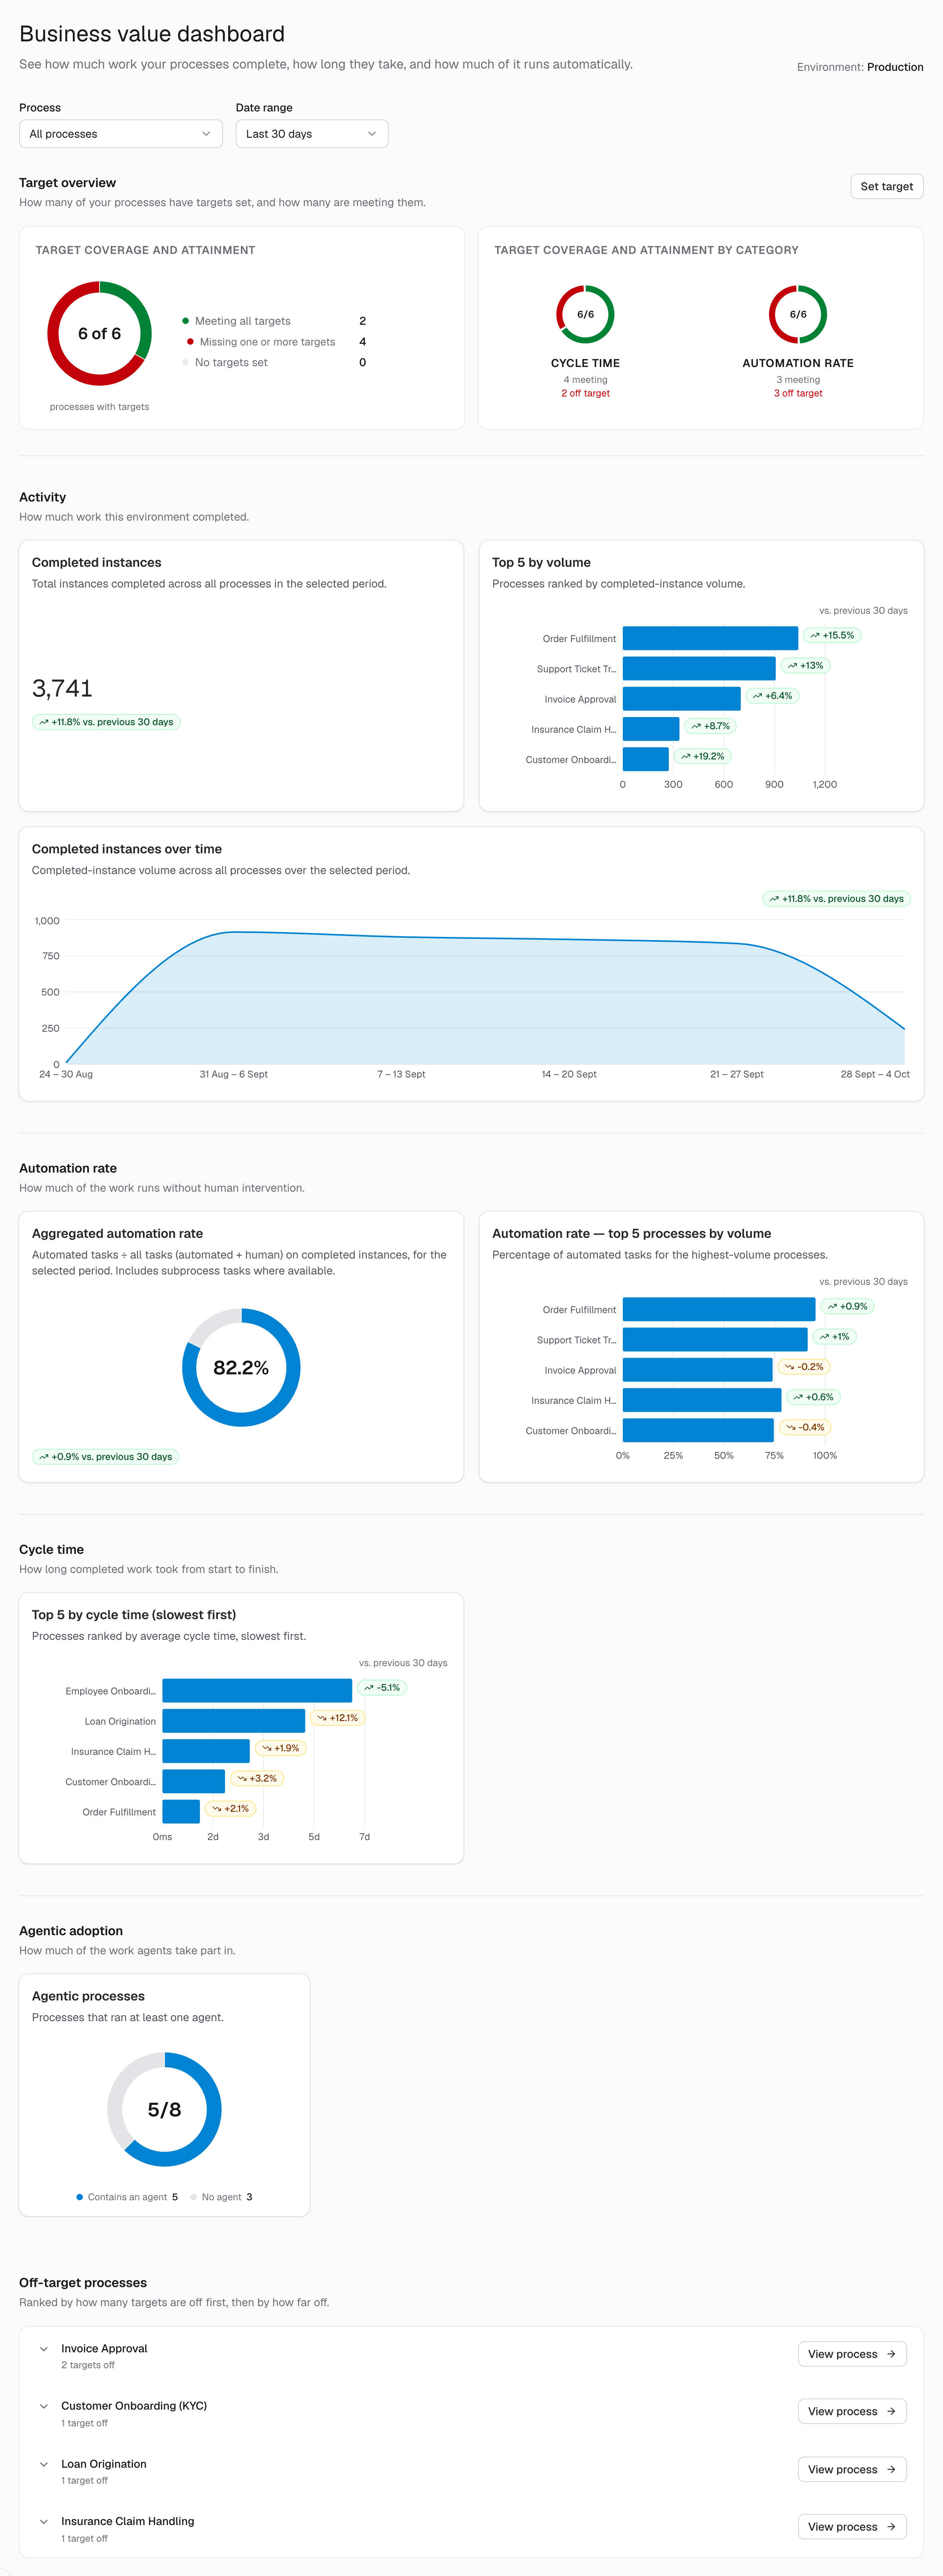
| Metric | What it shows | How to interpret it |
|---|---|---|
| Target coverage and attainment | How many active processes have at least one target set, and how many configured targets are currently met. | Low coverage means the summary reflects only a subset of your processes. |
| Activity | Completed work handled and how it changes over time. | Use activity as context for the other metrics. Activity isn't compared against a target. |
| Automation rate | The aggregated automation rate for the environment, plus a per-process comparison. | Use it to find processes that still rely heavily on manual work. |
| Cycle time | A process-by-process comparison and the longest-running processes. | Use it to find where processes take longest to complete. |
| Agentic adoption | Which processes use agentic steps. | Use it to see where AI agents already handle part of the work. |
| Off-target processes | Processes with missed targets, ranked first by the number of missed targets and then by the size of the deviation. | Start with the top entry. See investigate a missed target. |
Review the process view
The process view shows the metrics and targets for a single process. Open it by selecting a process from the portfolio view.
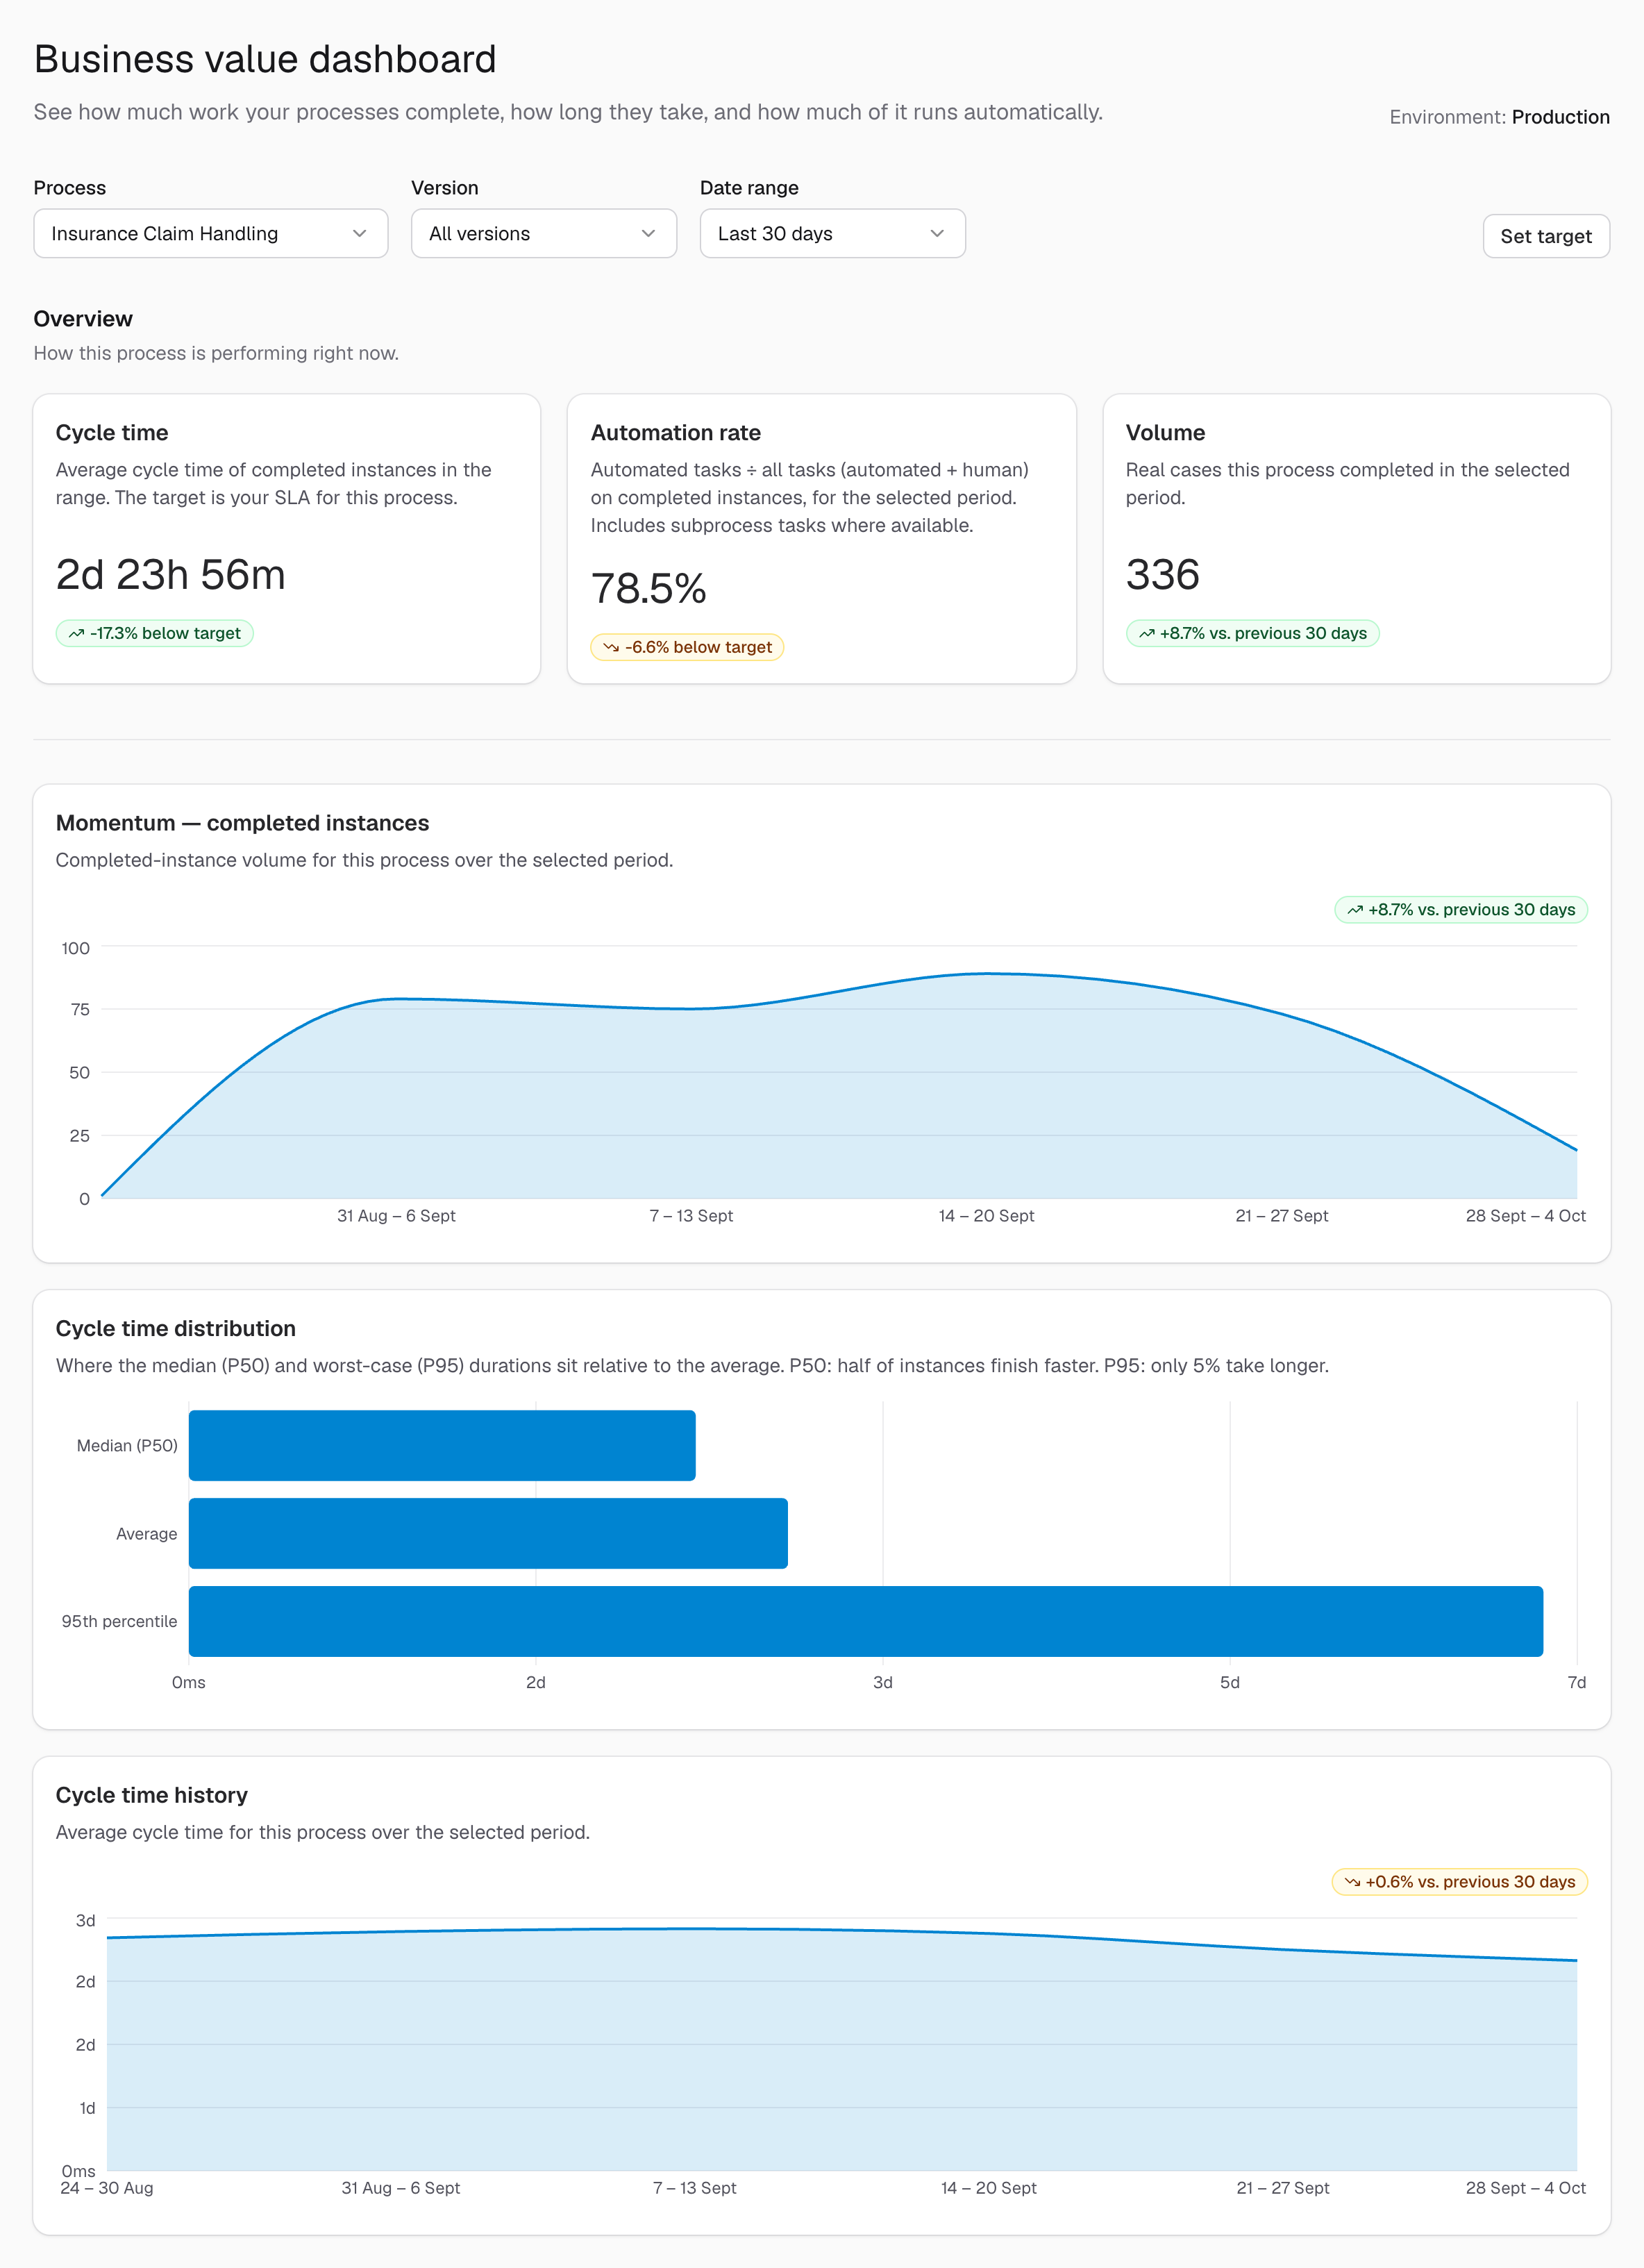
| Element | What it shows |
|---|---|
| Per-metric value and status | The current value for each metric, whether its target is met, and where available, by how much it is met or missed. |
| Activity | Completed work handled for this process in the selected scope. |
| Trends | How activity and cycle time change over time, rather than a single snapshot. |
| Cycle time distribution | P50, average, and P95 where available, so you can compare typical durations with higher-percentile durations. |
| Version context | Version selection or release-over-release comparison where available, so you can see how a release performed. |
| Target actions | Set target for the metrics this process supports. |
Set targets
Each target is optional and set independently, so you can set a cycle time target without setting an automation rate target.
| Metric | Direction |
|---|---|
| Cycle time | Lower is better |
| Automation rate | Higher is better |
To set a target:
- Open the process view for the process you want to set a target for.
- Click Set target to open the Set targets dialog.
- Review the current baseline shown beside the target input, where supported.
- Enter the target value and click Save targets.
Use the baseline to set a meaningful target relative to current performance. A target that is too far from the baseline may provide little useful information about progress.
Filter the results
Filters change which completed instances are counted, so a target that is met over one date range can be missed over another.
| Filter | What it does |
|---|---|
| Environment | Selects the environment to report on. Required. |
| Process | Limits results to one process. |
| Date range | Limits results to instances completed within the range. |
| Version | Limits results to one process version. Available once you have selected a process. |
When you share a number from the dashboard, include the filters it was measured with. An automation rate of 94% over the last 30 days in one environment is not the same as 94% overall.
Investigate a missed target
The dashboard shows which target was missed and by how much, but not which process instances contributed to the missed target or why.
- In the portfolio view, open Off-target processes and start with the top entry.
- Follow the link to the process view to confirm the missed target, review the trend, and check whether the issue is concentrated in a specific version.
- If an operational investigation link is available, follow it to inspect the affected instances in Operate.
- For process analysis such as bottleneck and outlier detection, continue in Optimize.
Multi-tenancy
In Self-Managed, the business value dashboard follows the Optimize multi-tenancy model. In SaaS, the dashboard shows data from the default tenant only.
In a multi-tenant environment:
- Targets are created, read, updated, and evaluated per tenant. A target set for one tenant isn't visible to, or inherited by, another tenant using the same process.
- In the process view, select a tenant to scope both the process metrics and the target you're editing.
- The portfolio view reports across all tenants you're authorized to see.