Monitor your AI agents with Operate
Monitor and troubleshoot your AI agent process instances in real time using Operate
About
In this guide, you will:
- Inspect an AI agent's real-time state and usage metrics from its process instance in Operate.
- Review the agent's decision trail: the conversation history grouped by loop iteration, including the tools it selected and the results it received.
- Understand how the agent's conversation memory is stored.
Operate surfaces the agent's state, metrics, and conversation history directly, so you rarely need to inspect raw process variables. Some runtime artifacts, such as document storage contents, may still require additional configuration to view. See agent context and memory for how the underlying data is stored.
After completing this guide, you will be able to monitor, debug, and troubleshoot AI agent executions in Operate, including agents built with external frameworks such as LangGraph or CrewAI. See connect an external agent for how those agents report the same data.
Prerequisites
- You have access to Operate on Camunda 8.10 or later.
- You have the AI Agent Chat Quick Start model blueprint installed in a Camunda Hub project or open in Desktop Modeler.
This guide is a follow-up to build your first AI agent, where you use the same example AI agent process. We recommend completing that guide first. However, you can also apply this guide to other AI agent process implementations.
Step 1: Run your AI agent process
Run your process instance using a prompt to trigger the AI Agent connector. For example:
- Enter "Tell me a joke" in the How can I help you today? field.
- Click Start instance.
Step 2: Open the process instance in Operate
- Open Operate.
- Locate the process instance created by your prompt. See view a deployed process for more details.
- Open your process instance view by clicking on its process instance key.
At this point, you should see the process progressing through your model:
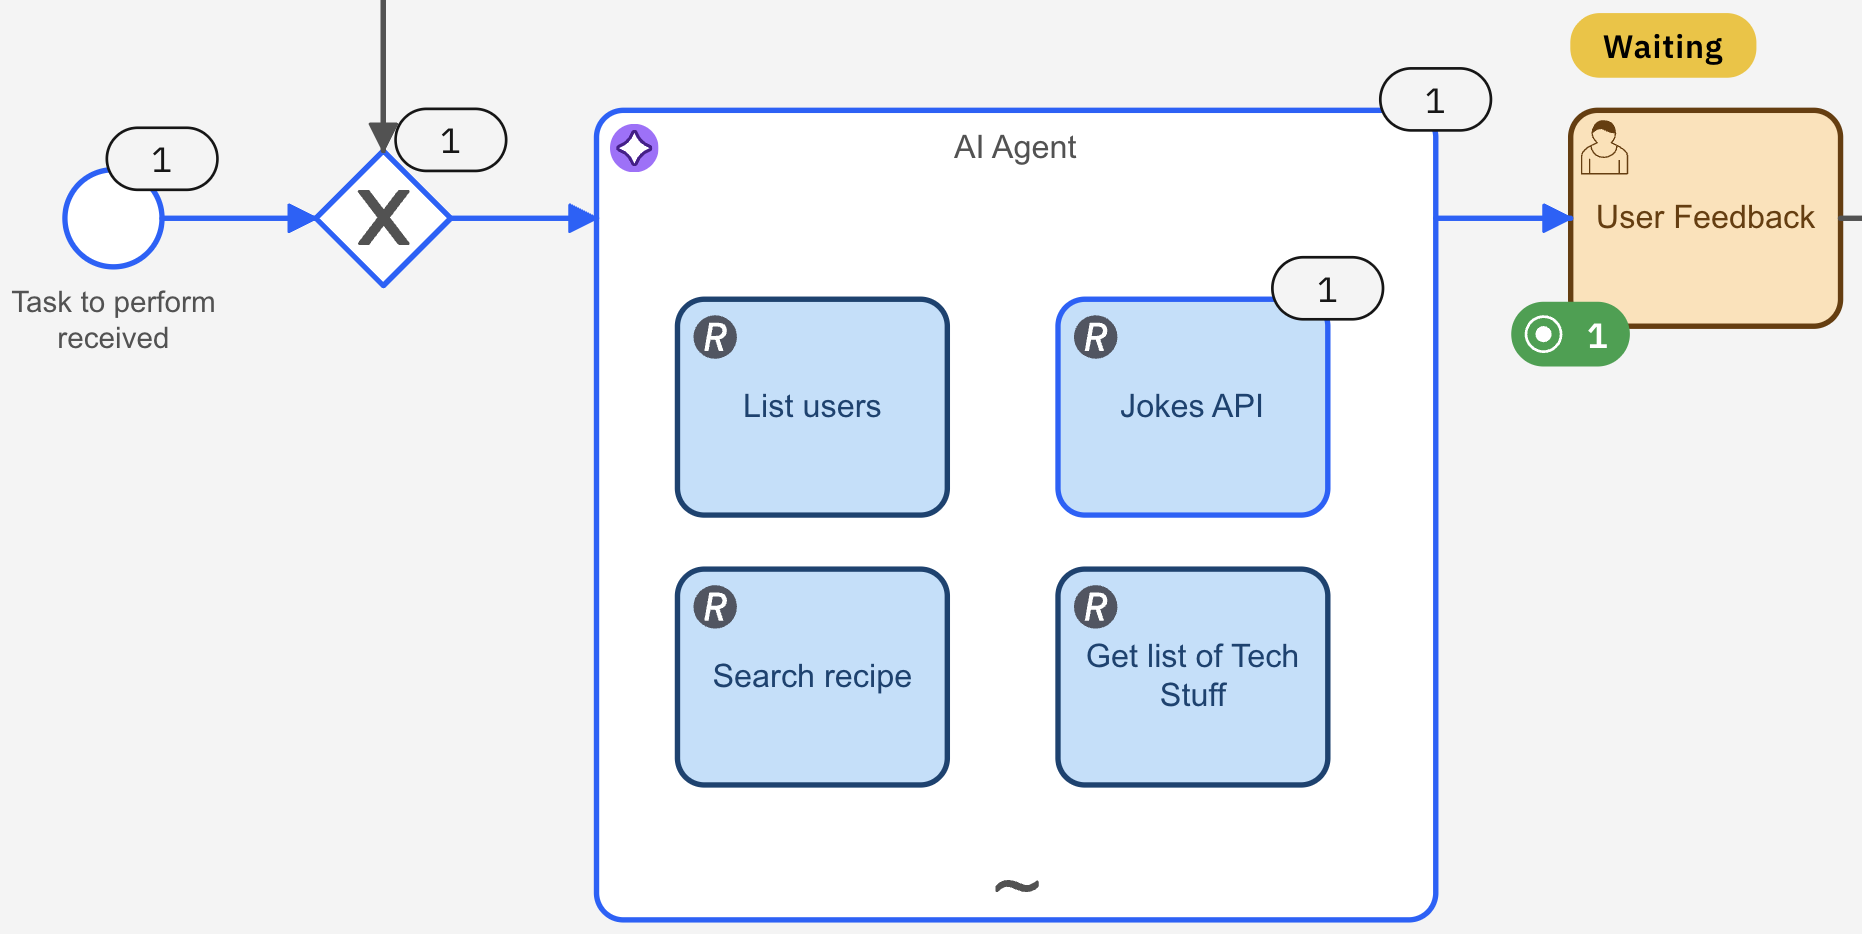
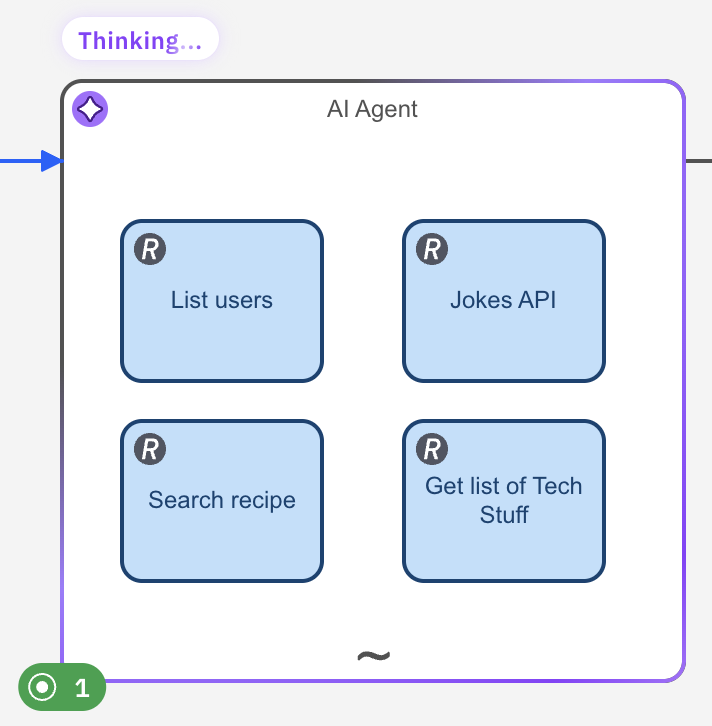
Operate highlights the agent element's current state. For example, Thinking while the agent reasons, or Tool calling while it calls the Jokes API tool. A simple prompt like this one moves through its loop quickly, so the agent instance may already show Idle or Completed by the time you look.
Step 3: Inspect the agent's state and usage metrics
Select the agent element on the diagram. Operate shows the data available for its agent instance, including:
- Its agent instance key, displayed above the status.
- Its current state, model, and system prompt.
- The tools resolved for it.
- Its usage metrics: token consumption, tool call count, and model call count against the configured limit.
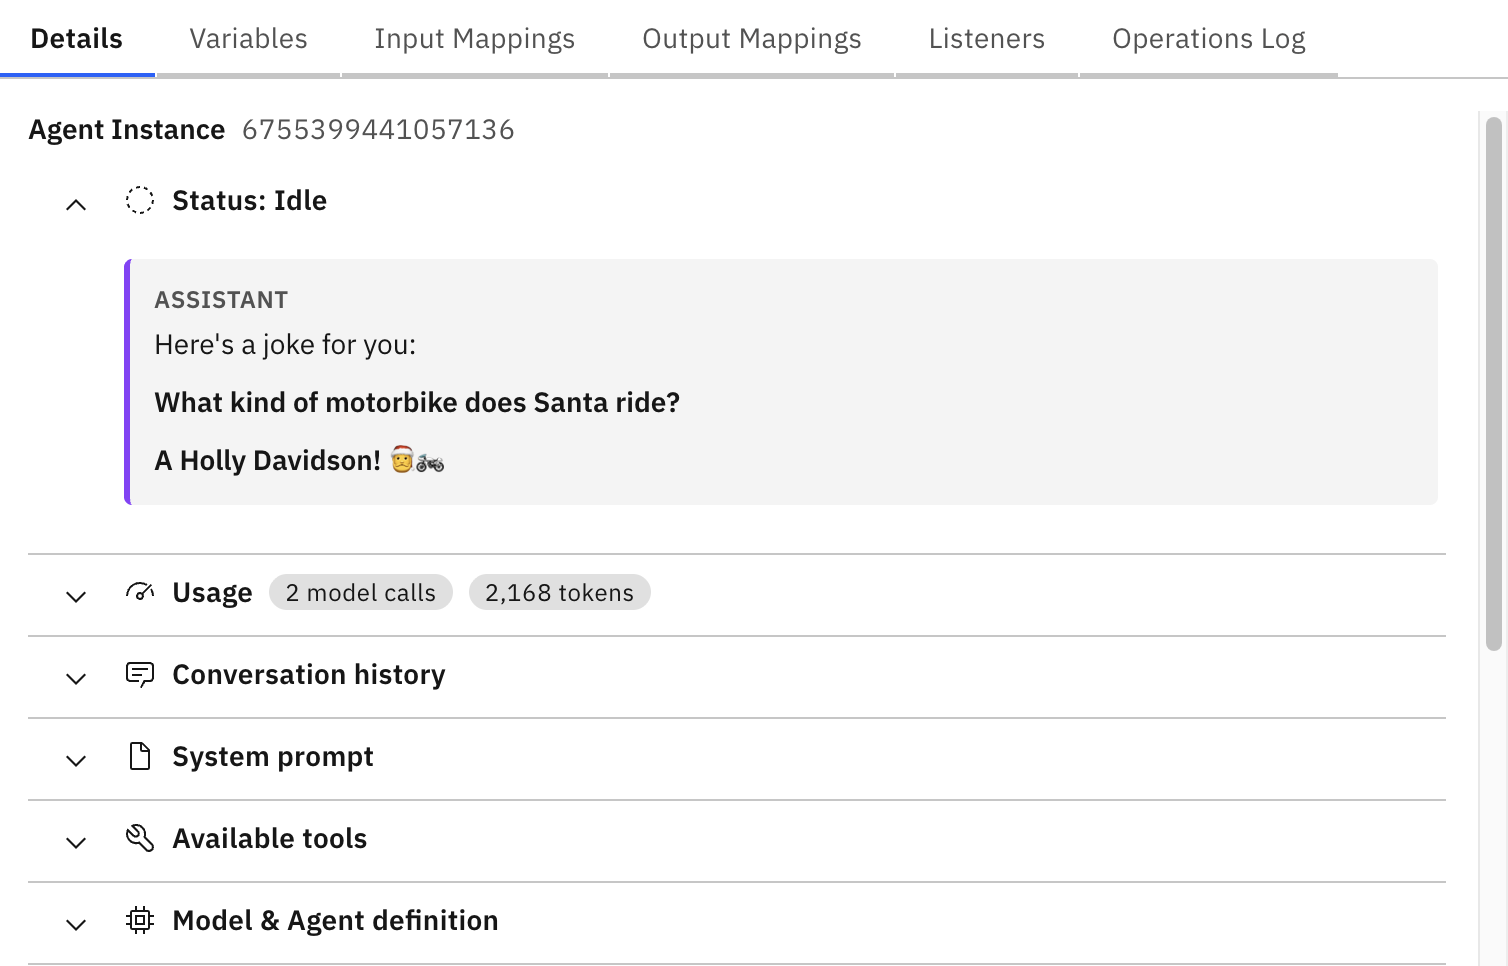
If multiple agent instances are active at the same element, use the dropdown next to the agent instance key to switch between them. Alternatively, select the relevant element instance in Instance History, as each element instance has only one agent instance.
For guidance on reading these signals to catch a stuck or looping agent, see detect off-rail agents.
Step 4: Review the conversation history
The conversation history is the agent's decision trail, grouped by loop iteration. Operate labels each group simply as iteration, for example 1. iteration.
By default, entries are sorted by Latest first. You can select Oldest first to read the history chronologically:
- Latest first: Quickly understand the current situation, typically when resolving a problem.
- Oldest first: Trace how the agent reached its current state, typically when building an agent for the first time.
For this example, the first iteration shows:
- The user prompt, "Tell me a joke."
- The assistant message where the agent selects the Jokes API tool, along with its reasoning.
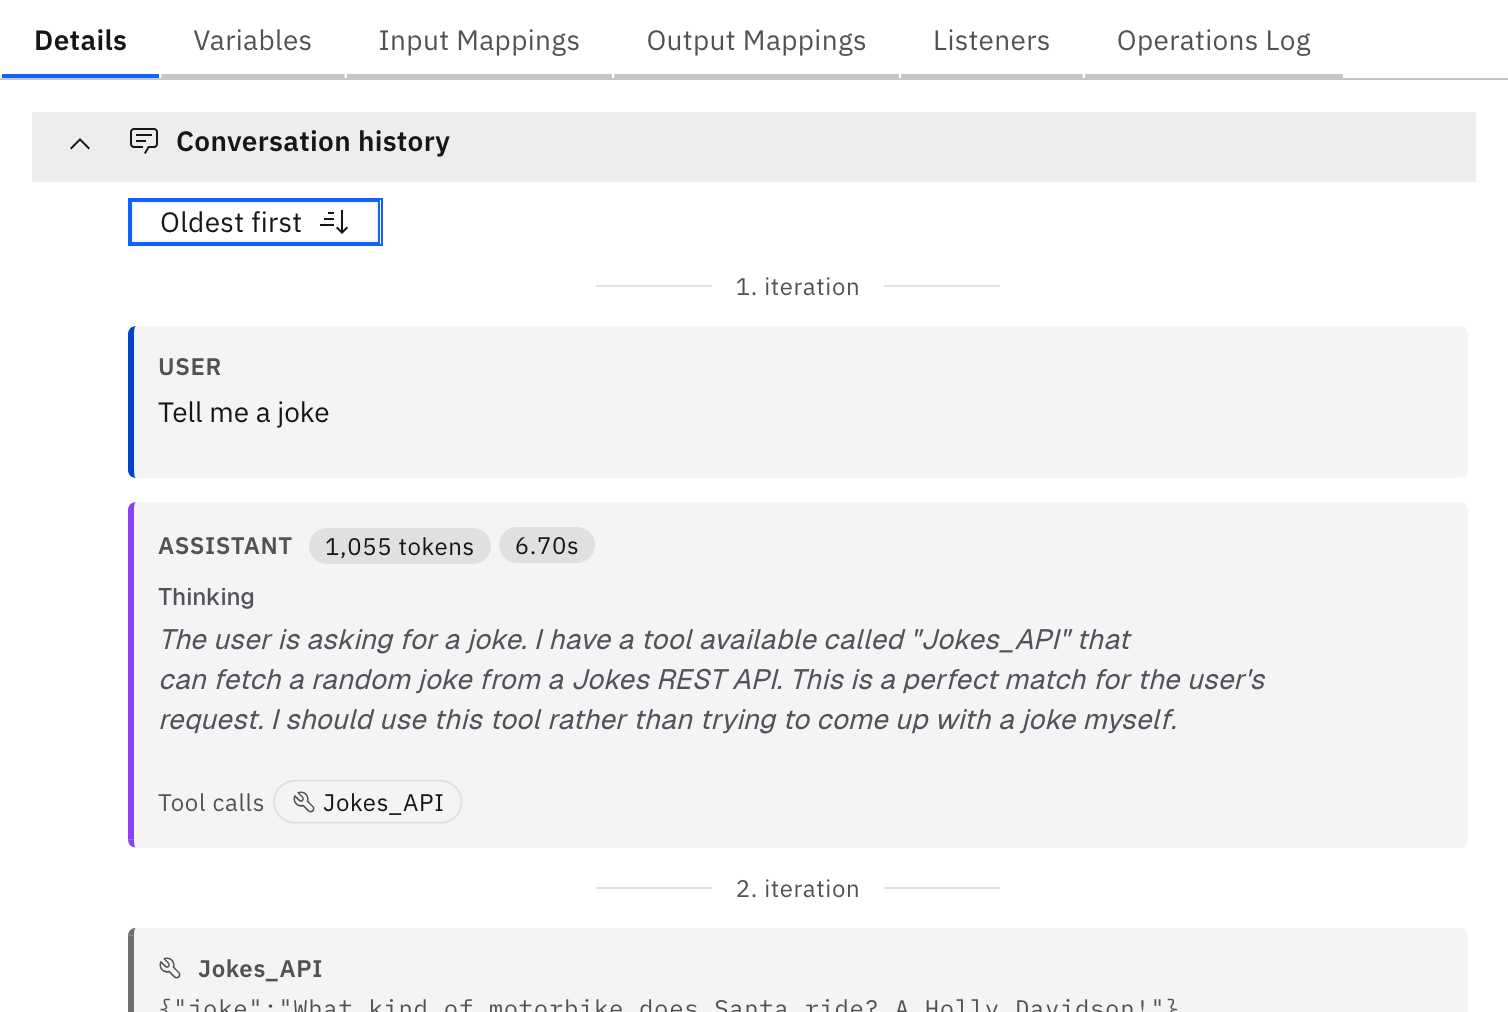
Hover over a message's token count or duration badge to see a breakdown of its usage metrics.
Operate shows Thinking and the formatted text only when the model returns reasoning content. To display readable model reasoning where supported, migrate to the 8.10 AI Agent element template.
Dive deeper into messages and tool calls
Every entry in the conversation history can be expanded for a closer look. Select the expand icon on a user or assistant message, or on a tool call, to open a larger view:
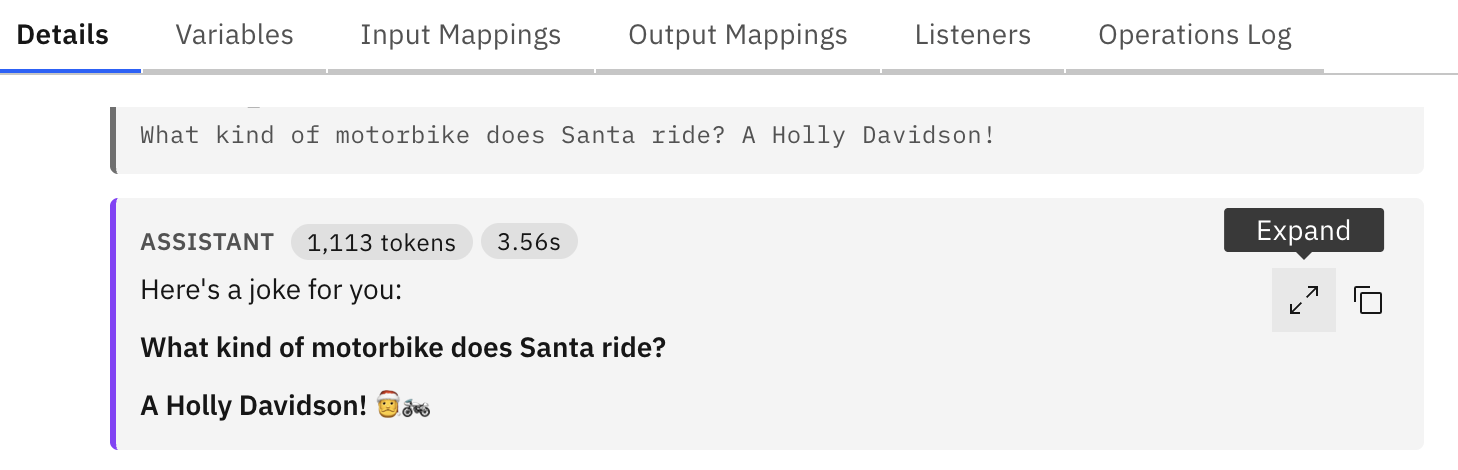
A user or assistant message may contain formatted text, so expanding it opens a Preview of its rendered Markdown by default. Switch to Source to view the raw Markdown instead.

Expanding a tool call shows the tool's description, along with the full input and output exchanged with it:

Use the copy icon in any of these expanded views to copy its content.
Step 5: Understand how agent memory is stored
In Camunda Hub or Desktop Modeler, within the AI Agent sub-process, you can define how the conversation memory is stored using the Memory storage type field.
By default, agent memory uses the In Process type, which stores it as part of the agent context, the same underlying data the conversation history in step 4 is built from.
Other available options include Camunda Document Storage, AWS AgentCore Memory, and a custom implementation. See memory for more details.
For a Camunda AI agent, this data is stored in the agentContext process variable. Open the element's Variables tab to inspect it directly, for example to check a runtime artifact not surfaced in the conversation history. See agent context and memory for how it's structured.
Step 6: Review the results
Go back to Operate. In the User Feedback element, you will see the execution count in green. This means the process instance execution is stopped there and waiting for action.
In this case, the required action is to provide feedback on the agent results. To do so:
- Open Tasklist.
- Locate the user feedback task and assign it to yourself by clicking Assign to me.
- Analyze the result. You will see a joke, as requested in the prompt.
- You can follow up with more prompts to continue testing your AI agent.
- Select the Are you satisfied with the result? checkbox when you want to finish the process, then click Complete task.
- Go back to Operate. You will see the process instance is now completed, and the end event has been triggered.
Next steps
Now that you know how to monitor your AI agents, you can:
- Analyze your AI agents with Optimize.
- Test your AI agents with Camunda Process Test, including handling non-deterministic flows and verifying AI-generated output.
- Learn more about Camunda agentic orchestration and the AI Agent connector.